Decoding Location Data: Social Distancing Timeline Infographic for PlaceIQ
INFOGRAPHIC & SOCIAL IMAGES | 2021
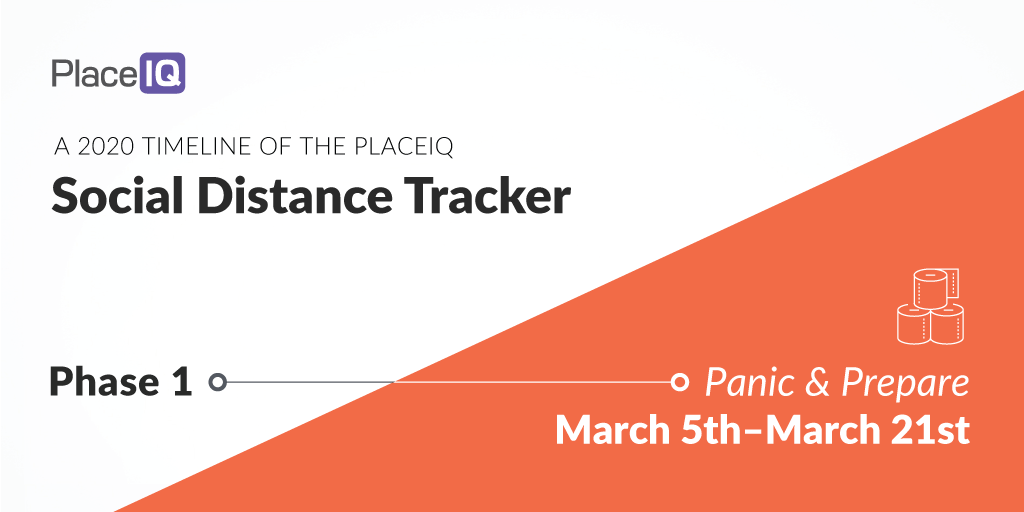
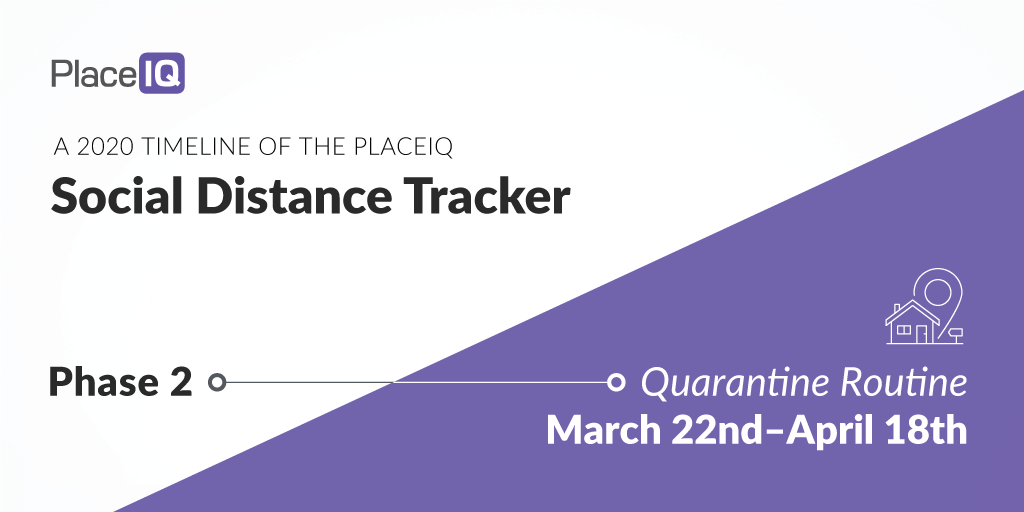
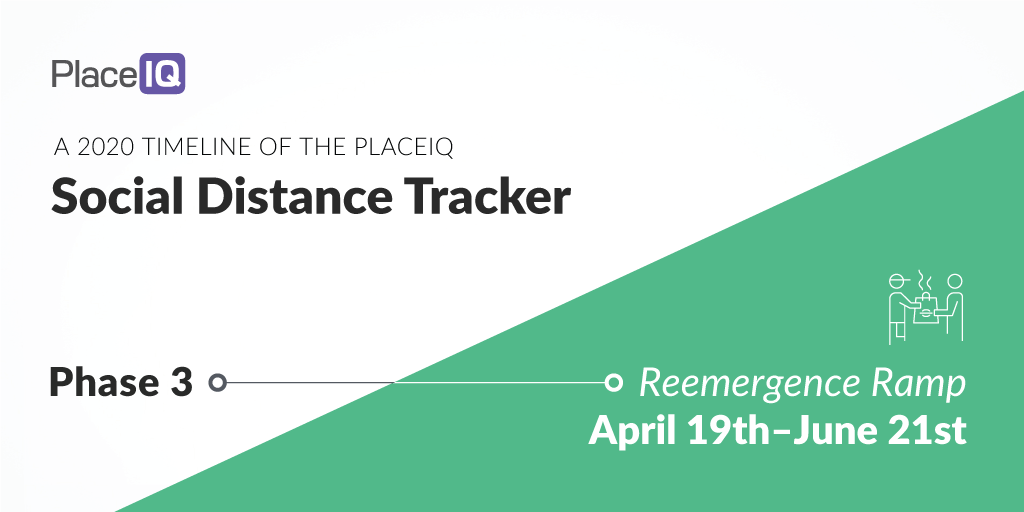
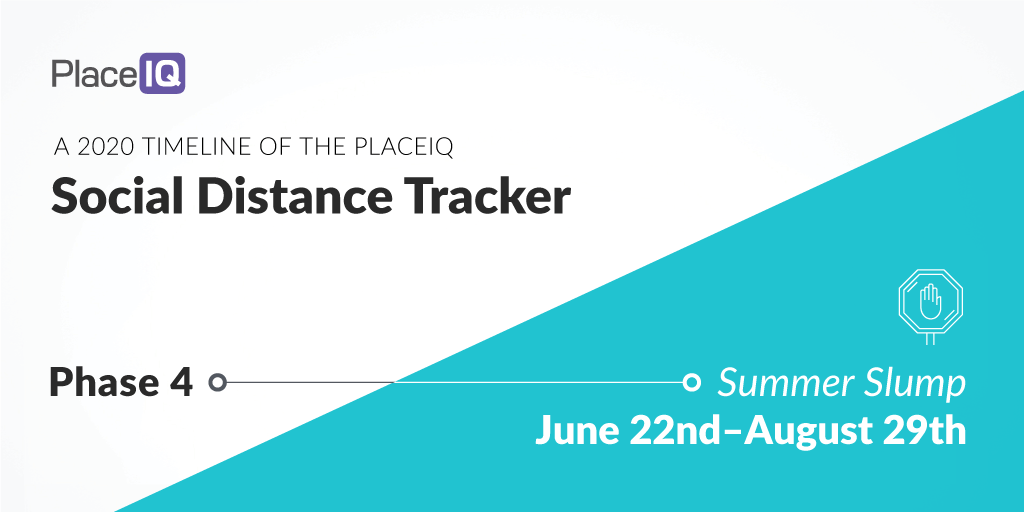
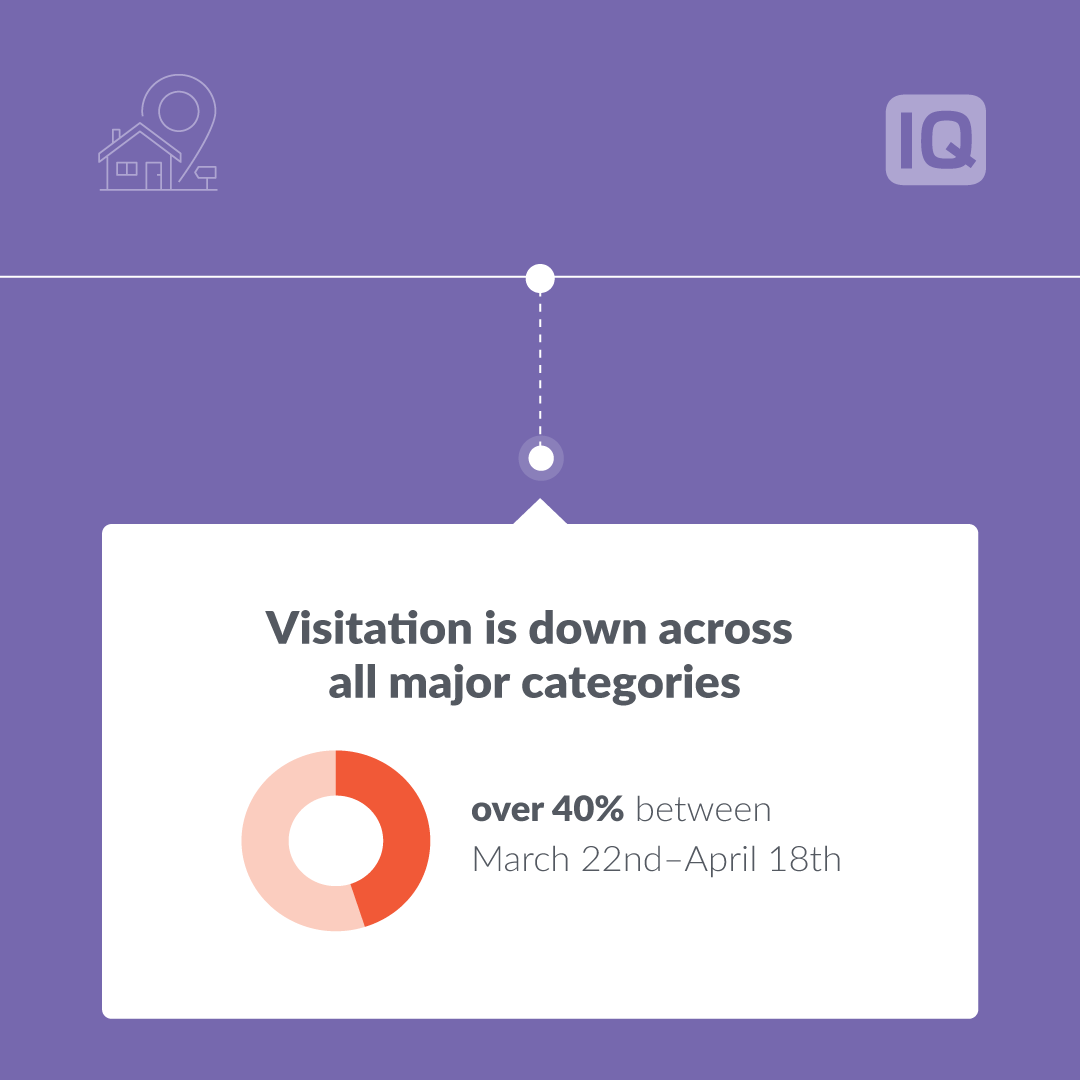
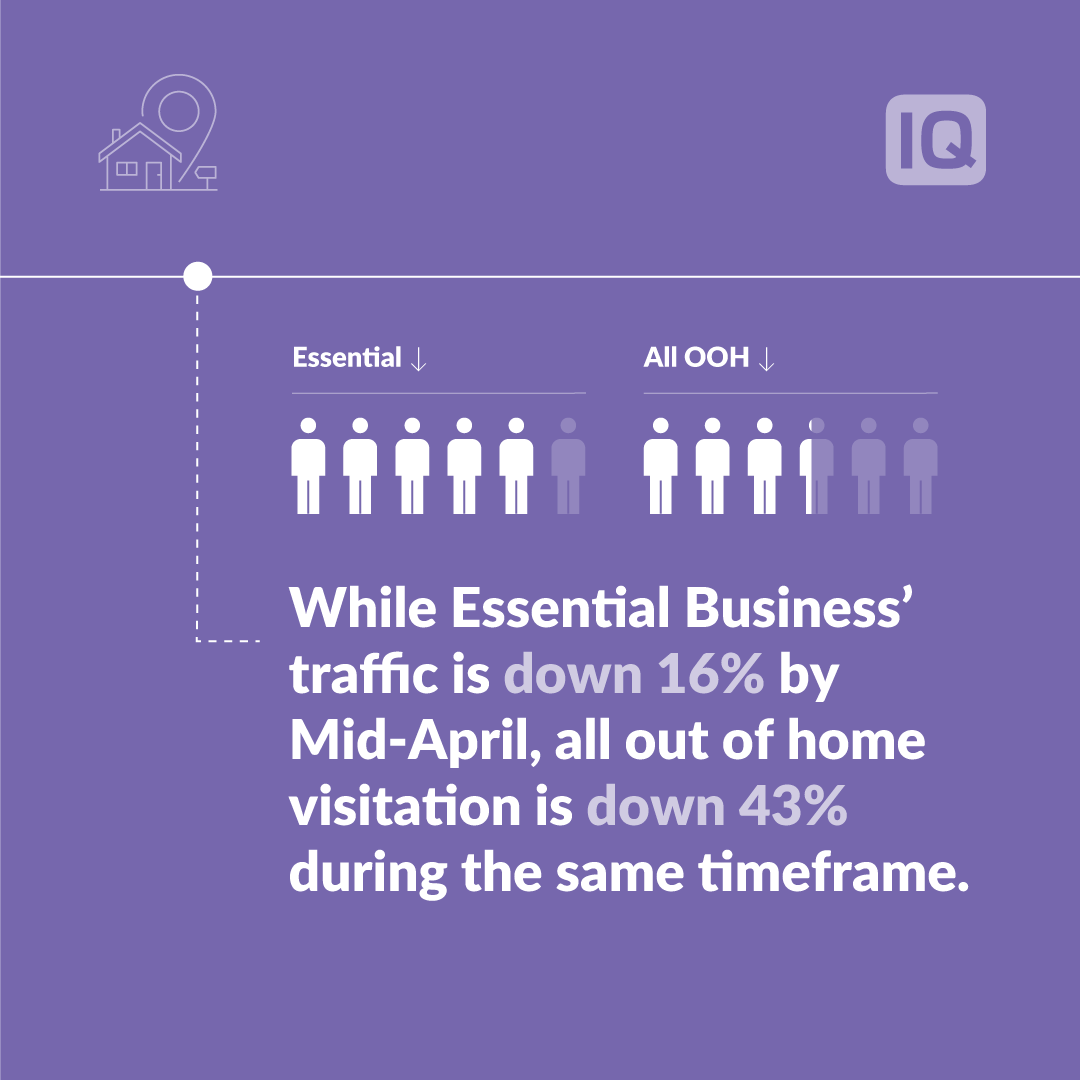
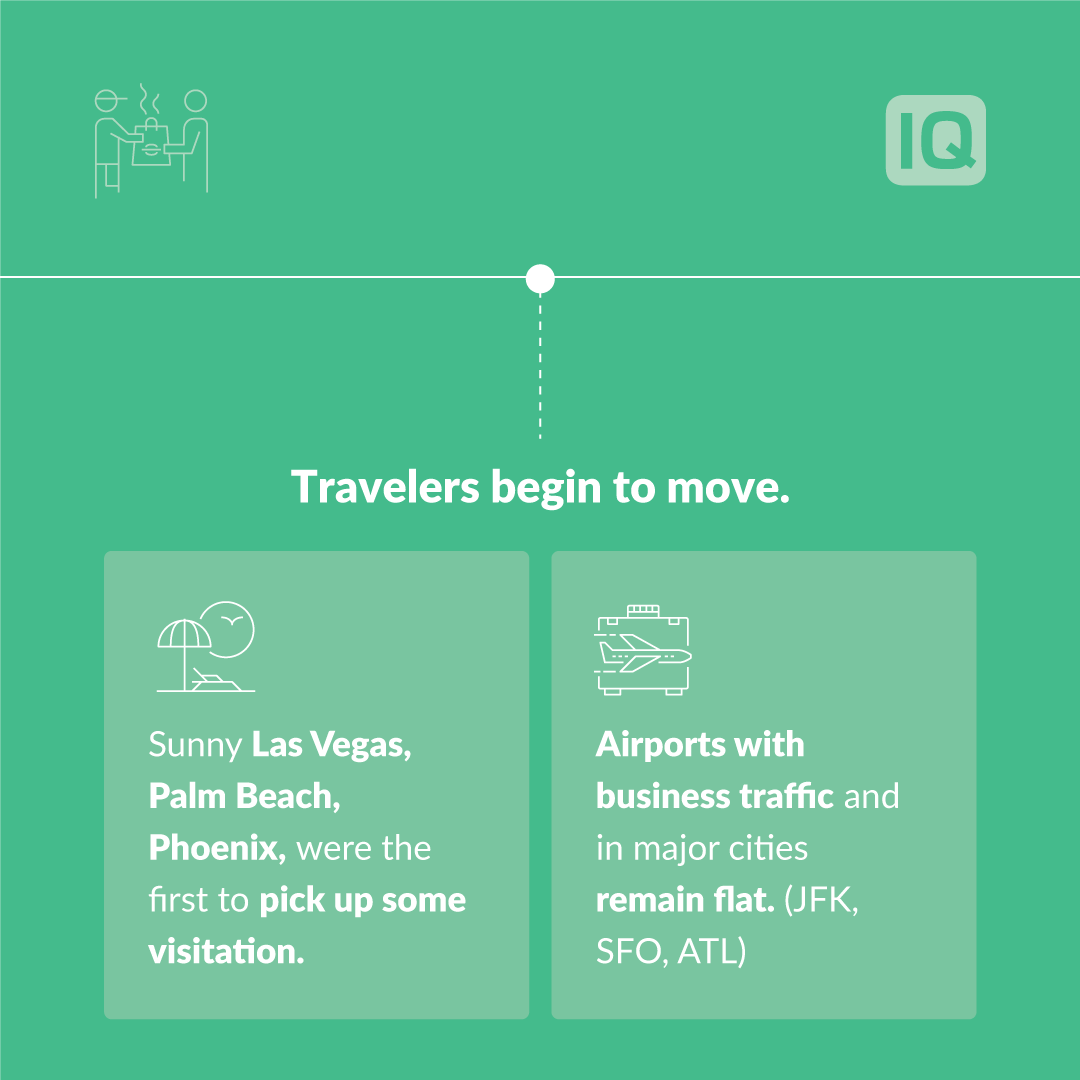
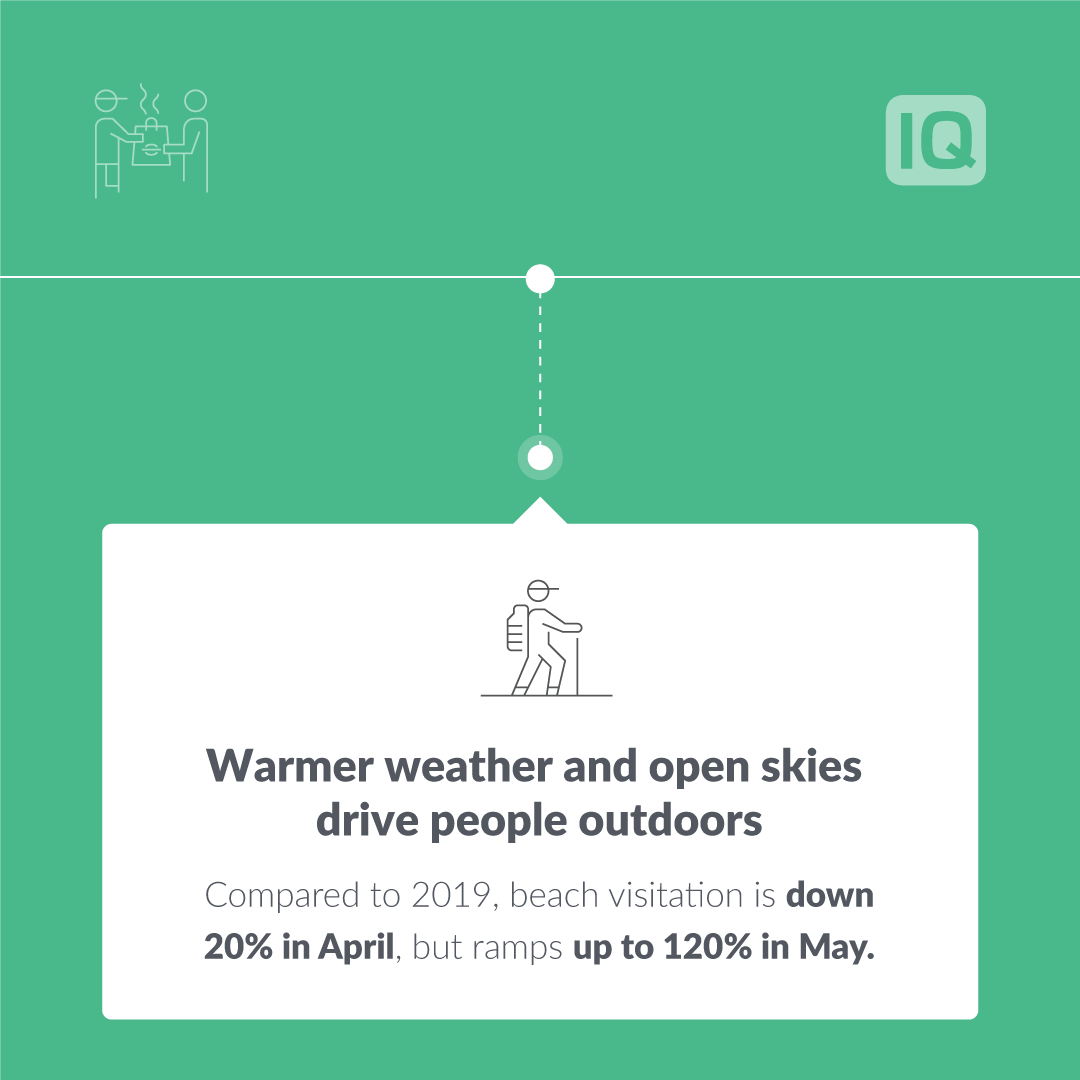
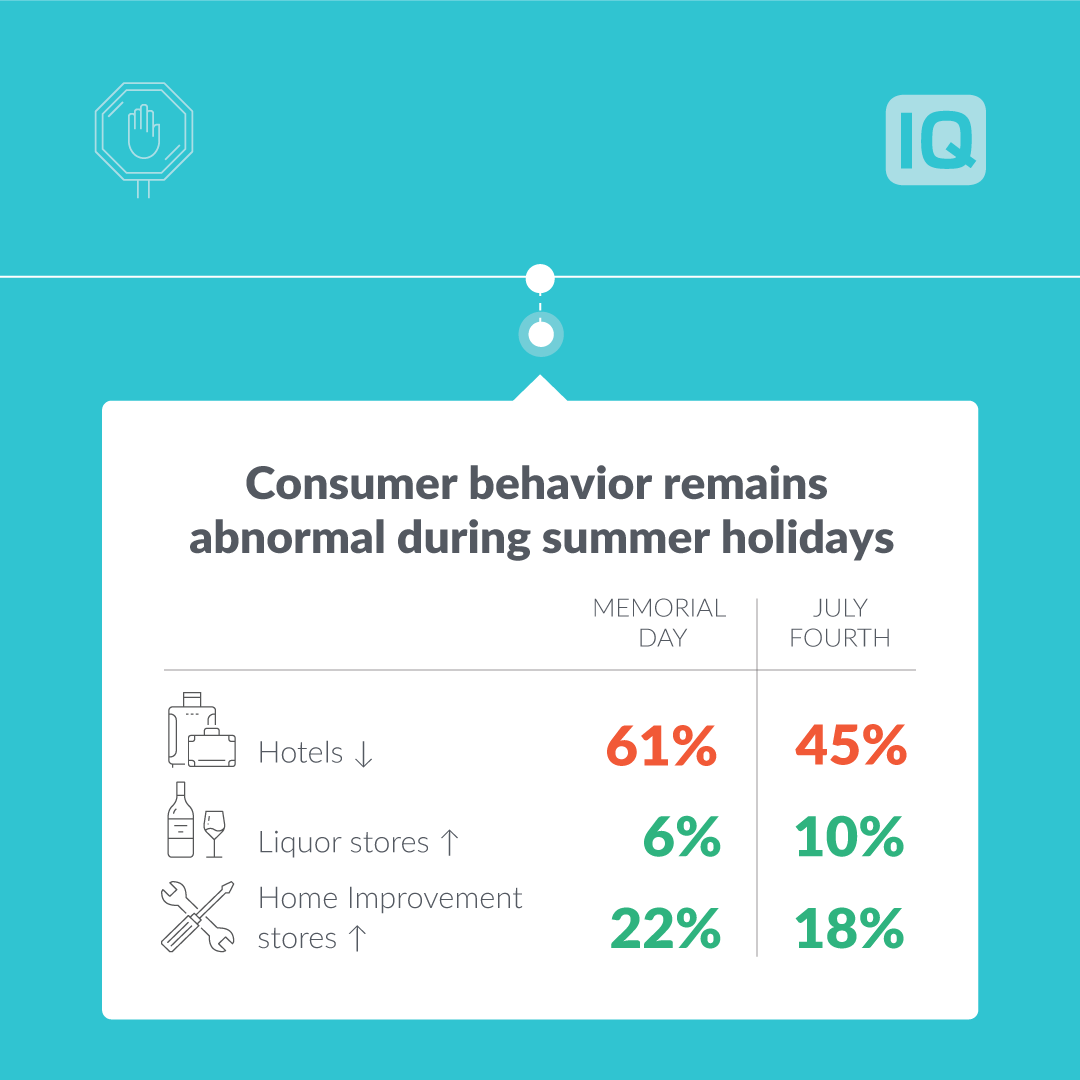
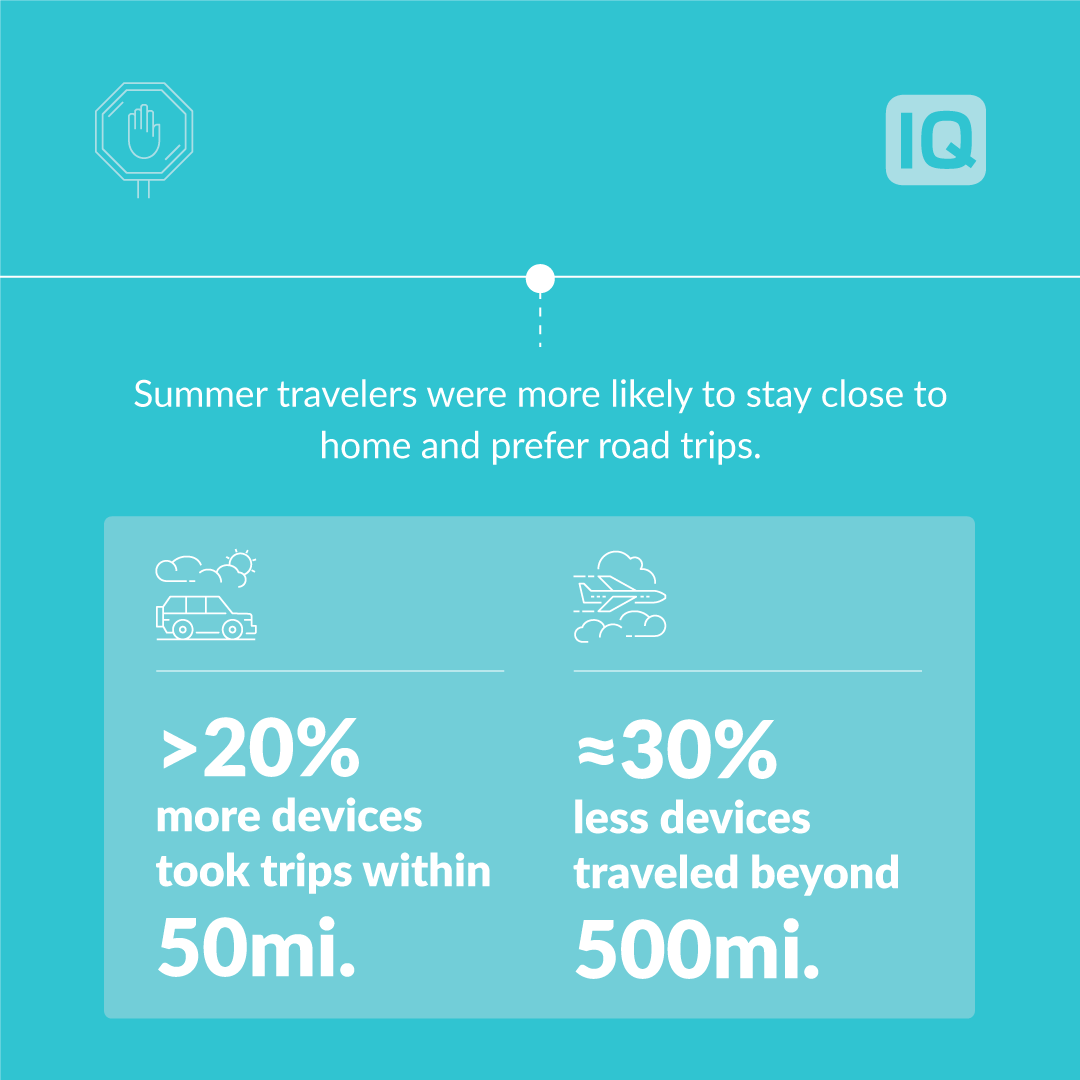
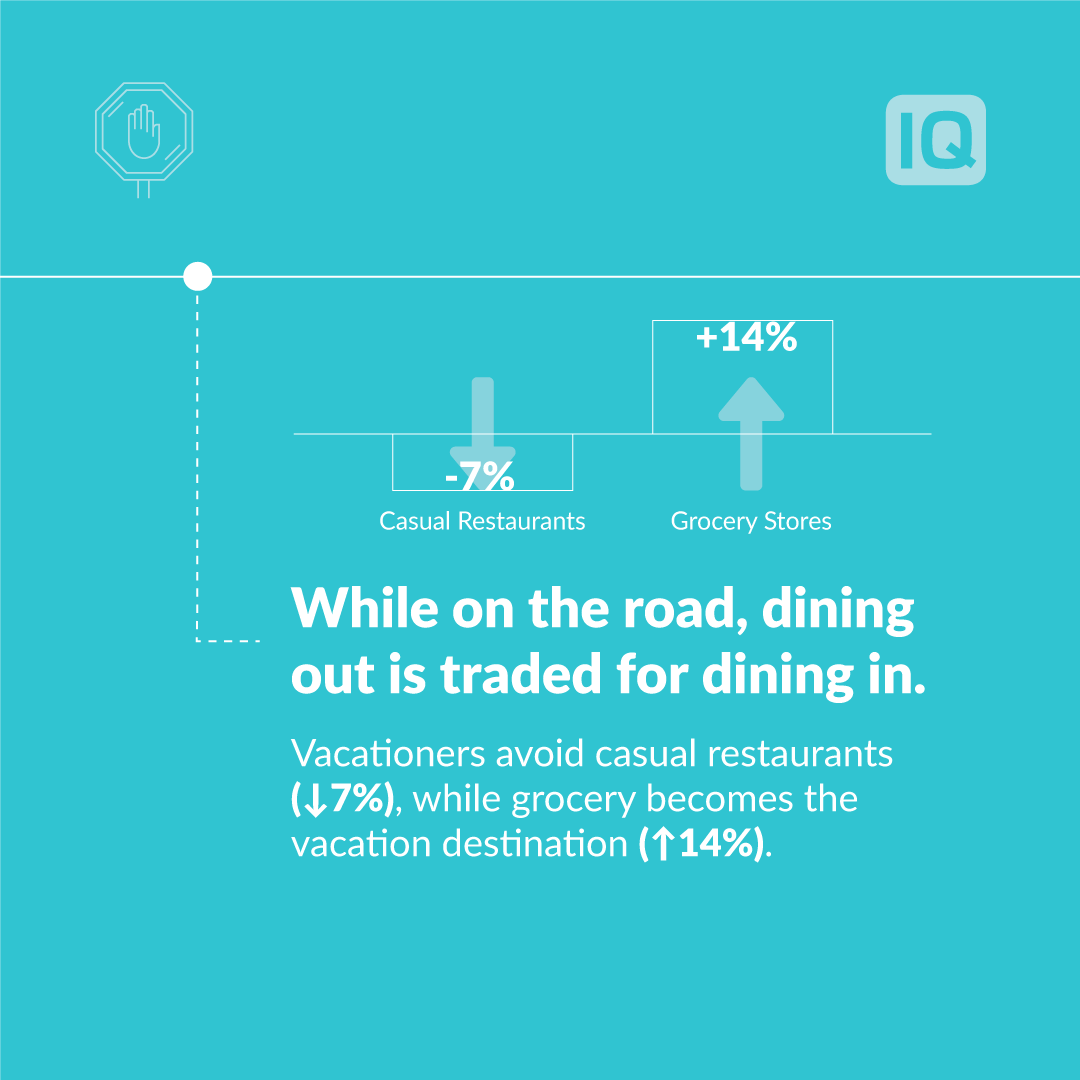
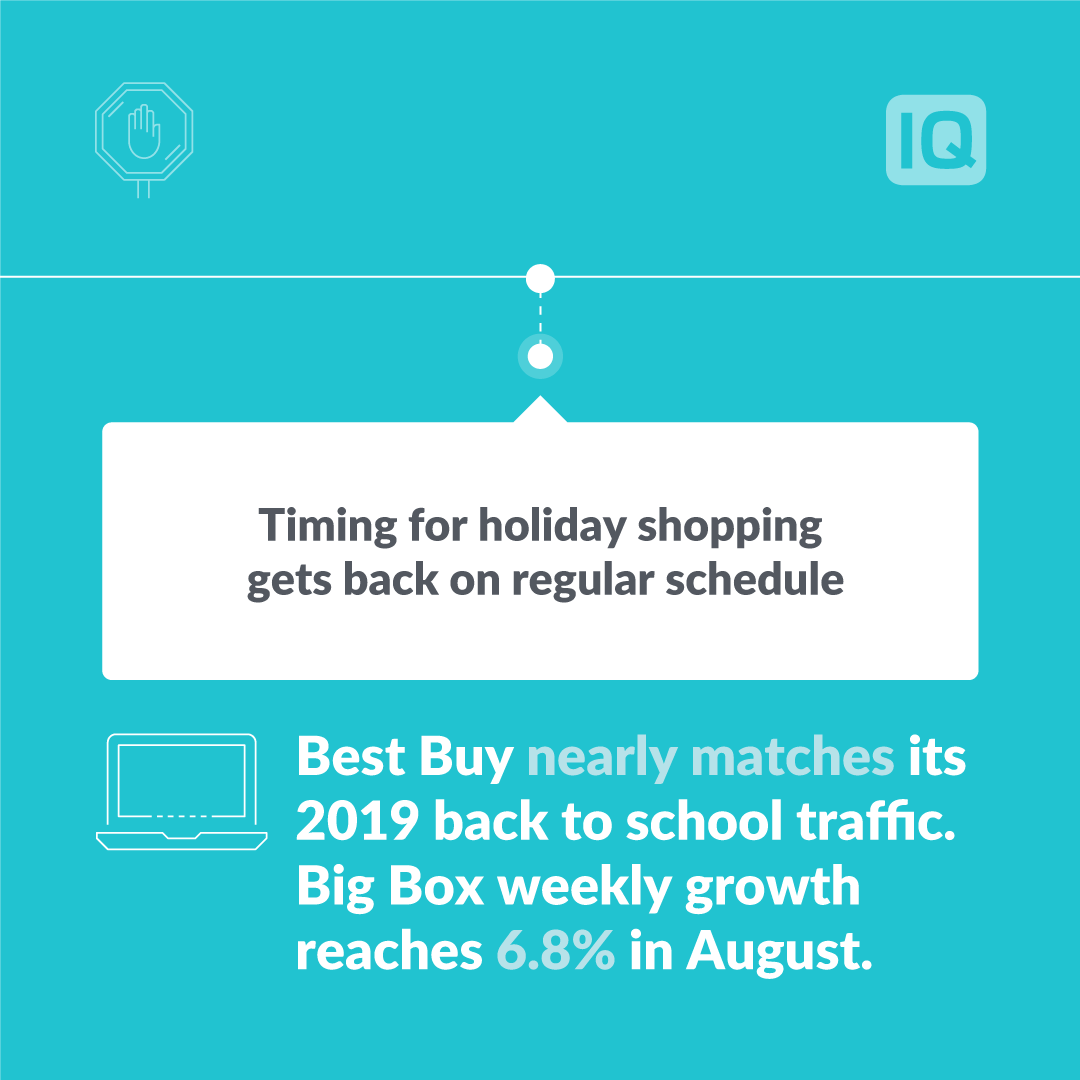
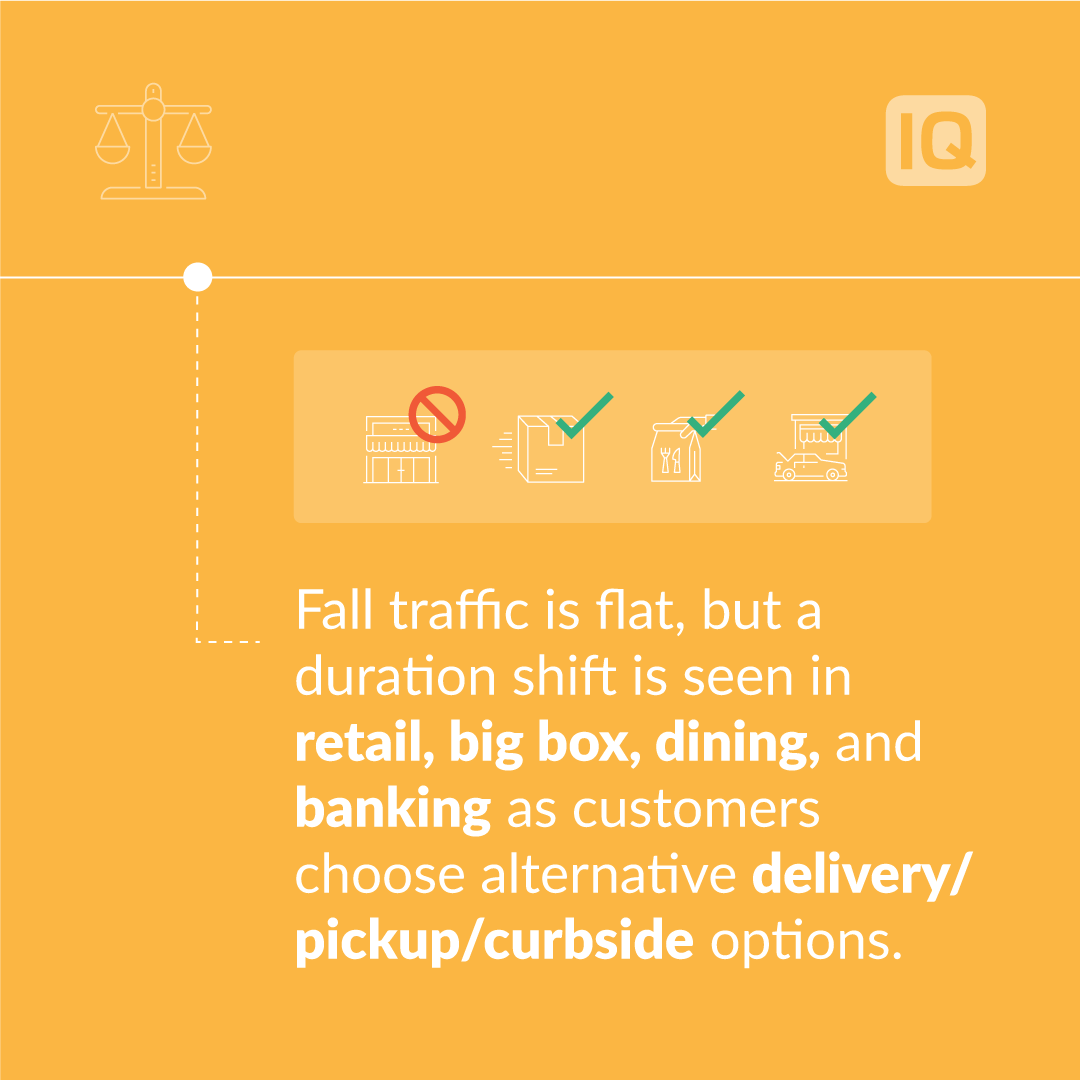
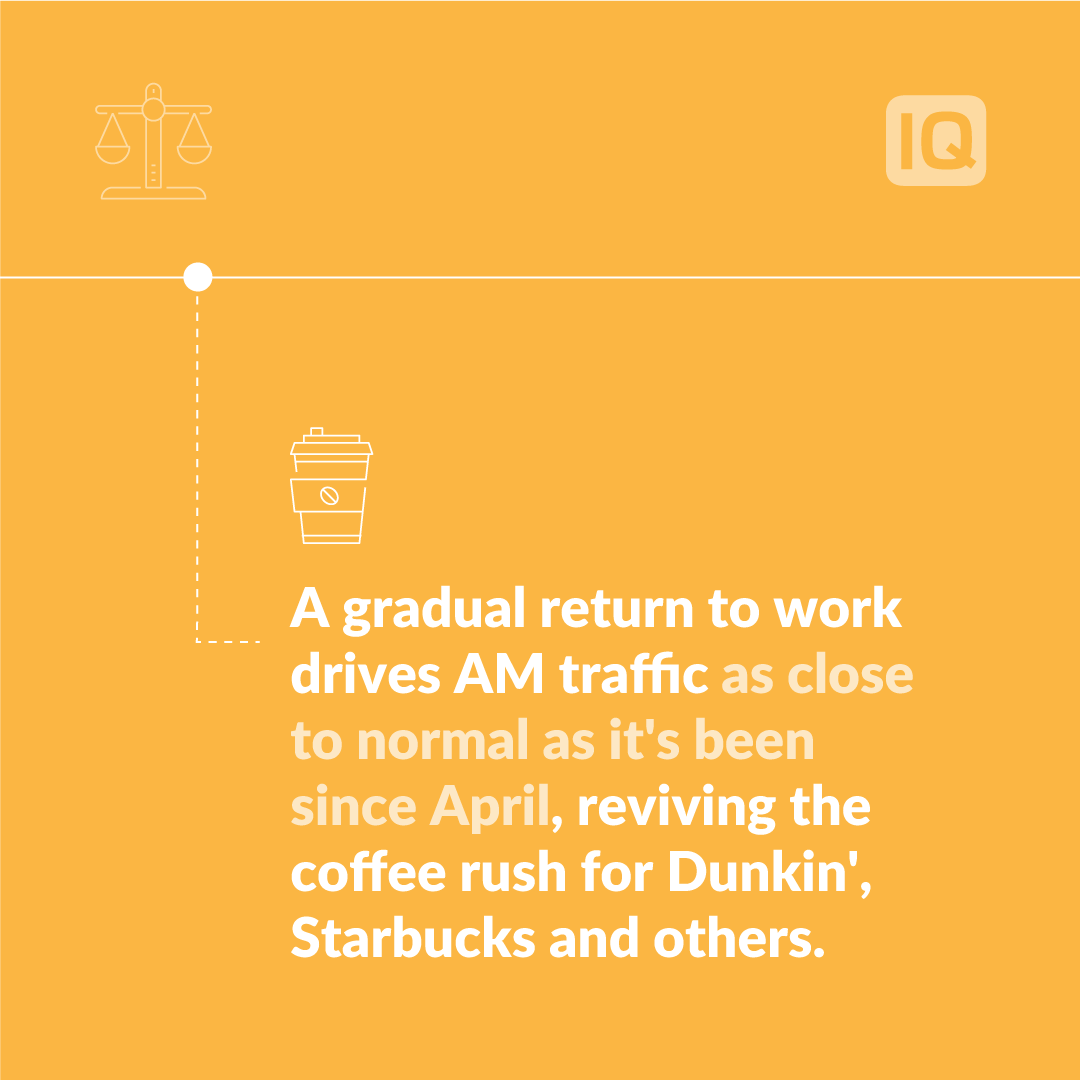
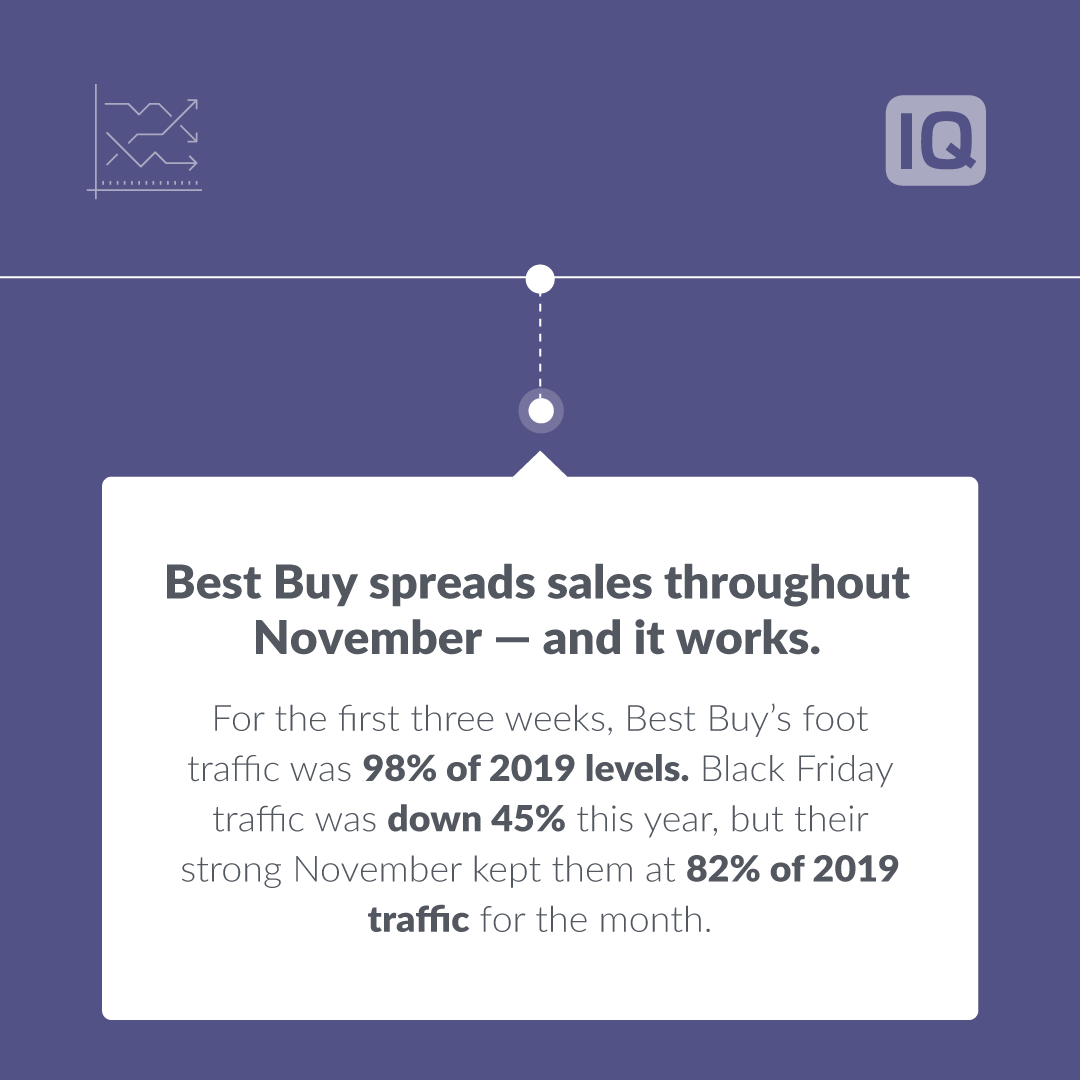
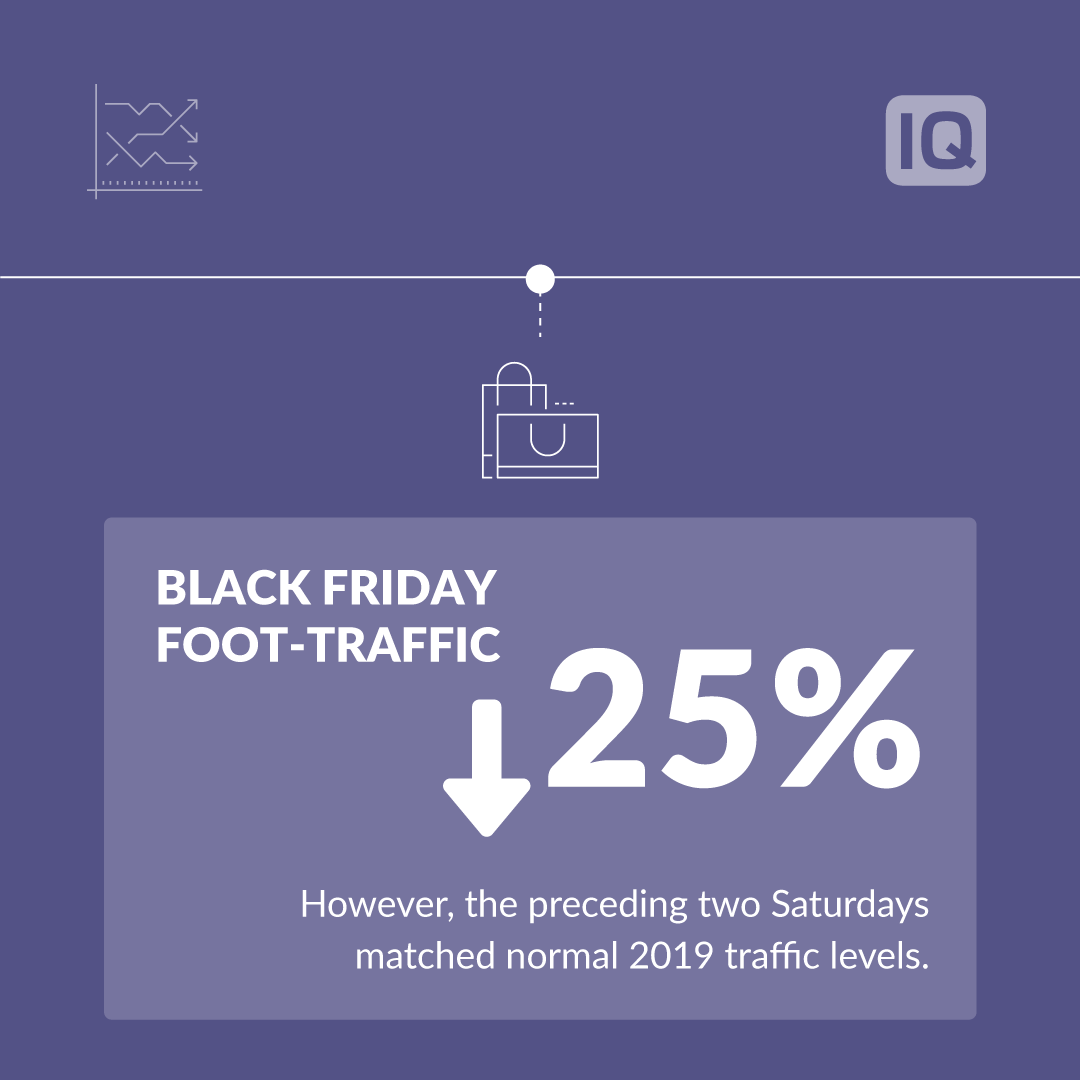
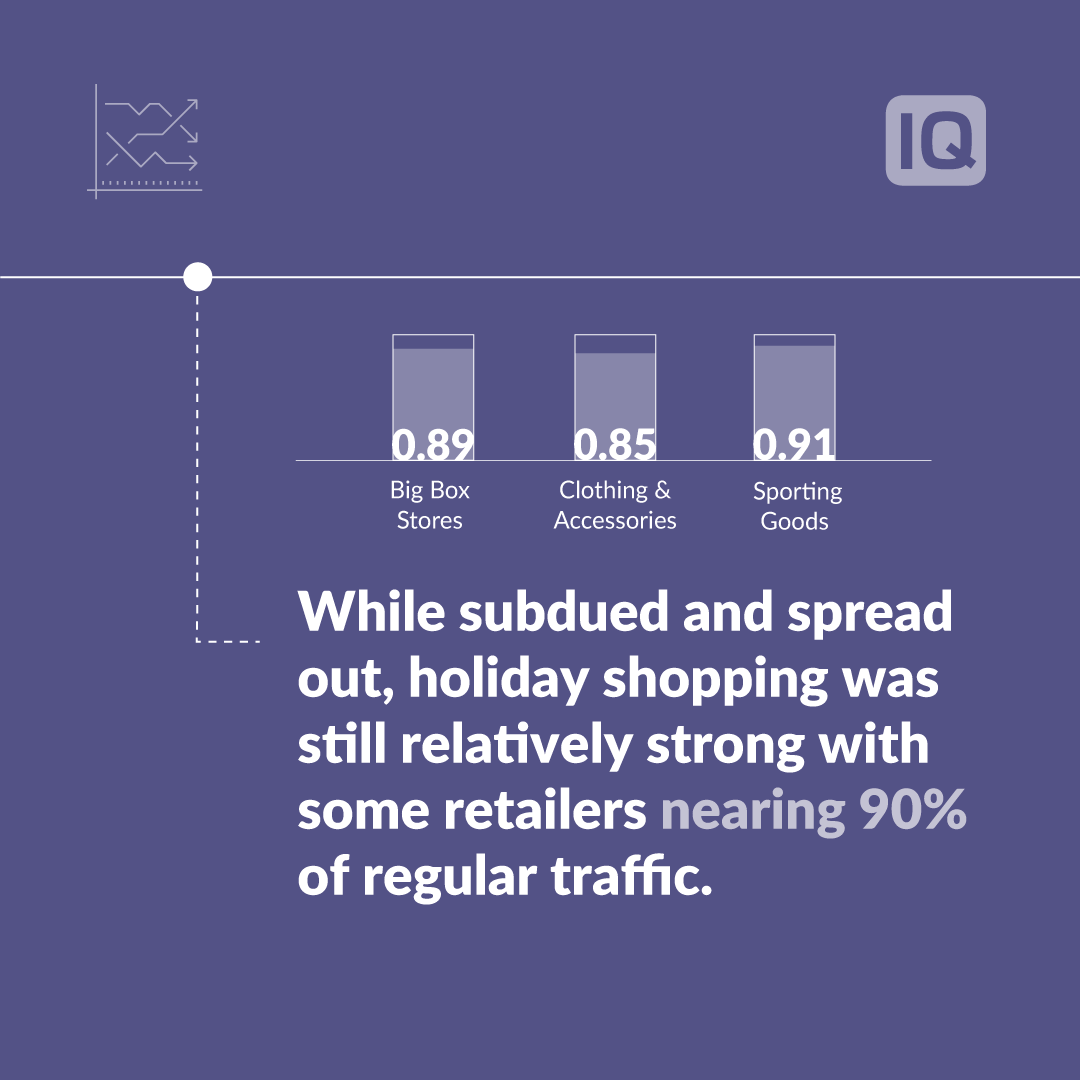
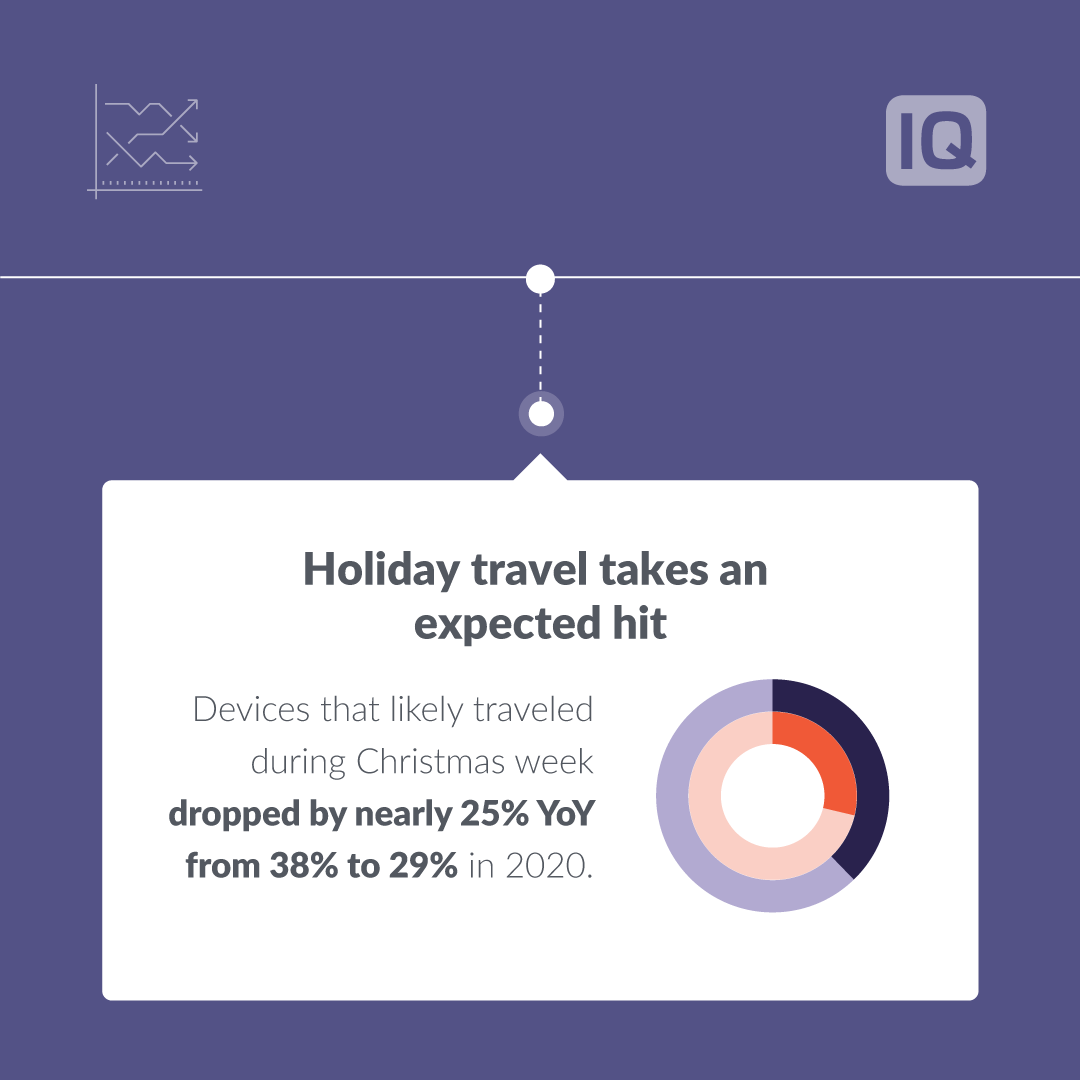
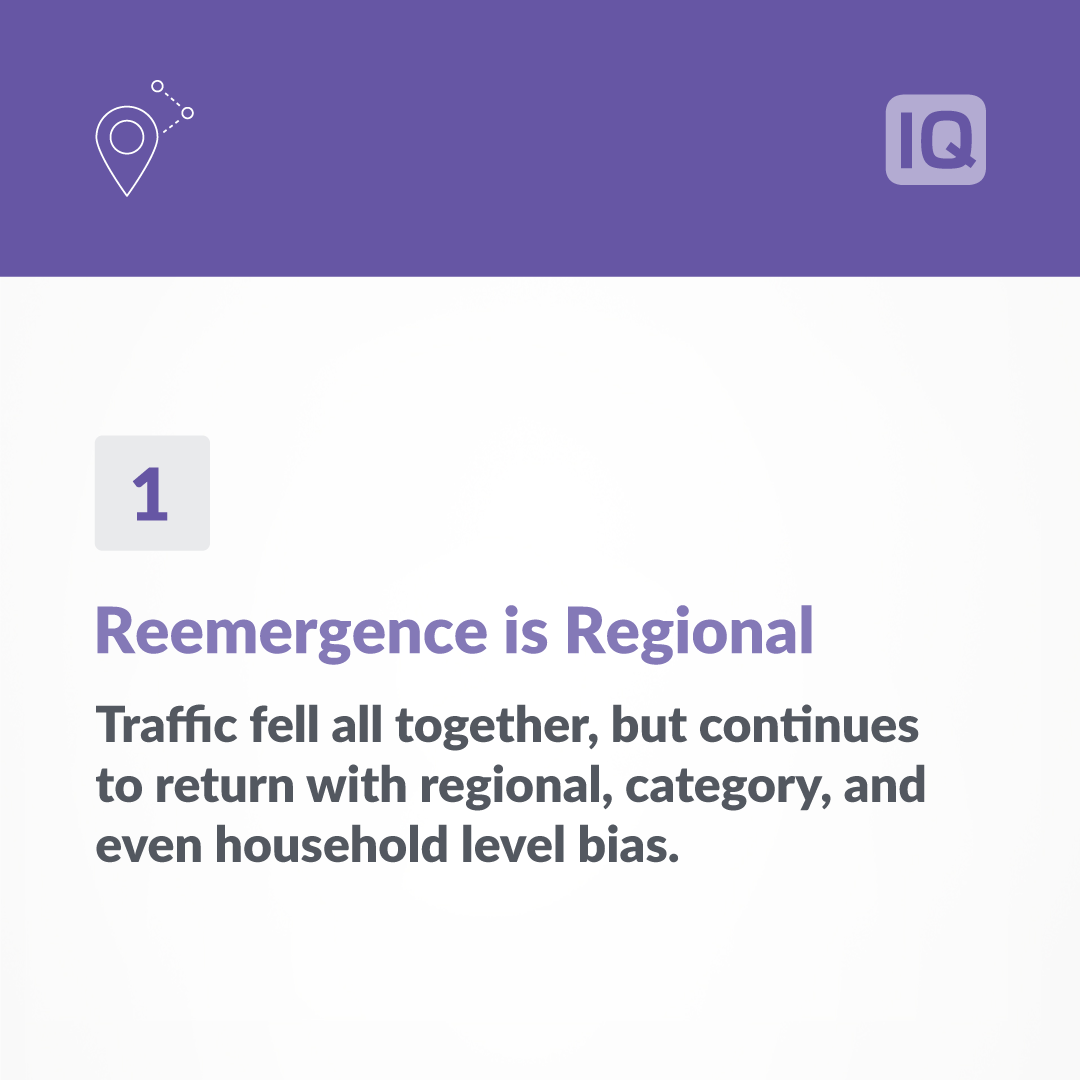
Crafted a visually engaging, data-driven infographic that distills complex location analytics from the first 9 months of the Covid-19 pandemic into a clear, compelling narrative.
Social Campaigns
LinkedIn carousel images:


X images: